Kilowatt-hours per panel: the solar math a homeowner can follow
A 'kW per roof' guess is the first thing the next installer picks apart. Here's how a panel's yearly kWh is worked out from its own datasheet.
When a homeowner asks "how do you know it'll make that much?", the honest answer shouldn't be spread across three files. A generic kW-per-roof guess doesn't say what each panel will make on that roof, and a guess the homeowner can't follow is the first thing the next installer picks apart.
Start with the panel, not the roof
For example, a 400-watt panel where the location gets 4.5 peak sun hours a day: 0.4 × 4.5 × 365 = 657 kWh a year, before losses. Use the real sun hours for the address; the numbers here are only to show the steps.
Then take off what the datasheet tells you
| Adjustment | Where it comes from | Why it matters |
|---|---|---|
| Heat | Temperature coefficient on the datasheet (% per °C above 25 °C) | Panels on a hot roof make less than their label watts |
| First-year fade | Datasheet degradation figure | Output drops a little in year one, then slowly after |
| Tilt and direction | That roof face's pitch and compass direction | A south face and a west face on the same house aren't equal |
| Shade | Trees and buildings along the sun's path, per panel | One shaded corner isn't the whole array |
Do it per panel, per roof face, and the total is something you can defend line by line.
Value it at two rates, not one
Power used in the house is worth the retail rate the homeowner would otherwise pay. Power sent to the grid is often credited at a different export rate. Put each at its own rate and show both, over the life of the system, and the savings number stops being a sales claim and becomes arithmetic.
How ROI SolarStrike does it
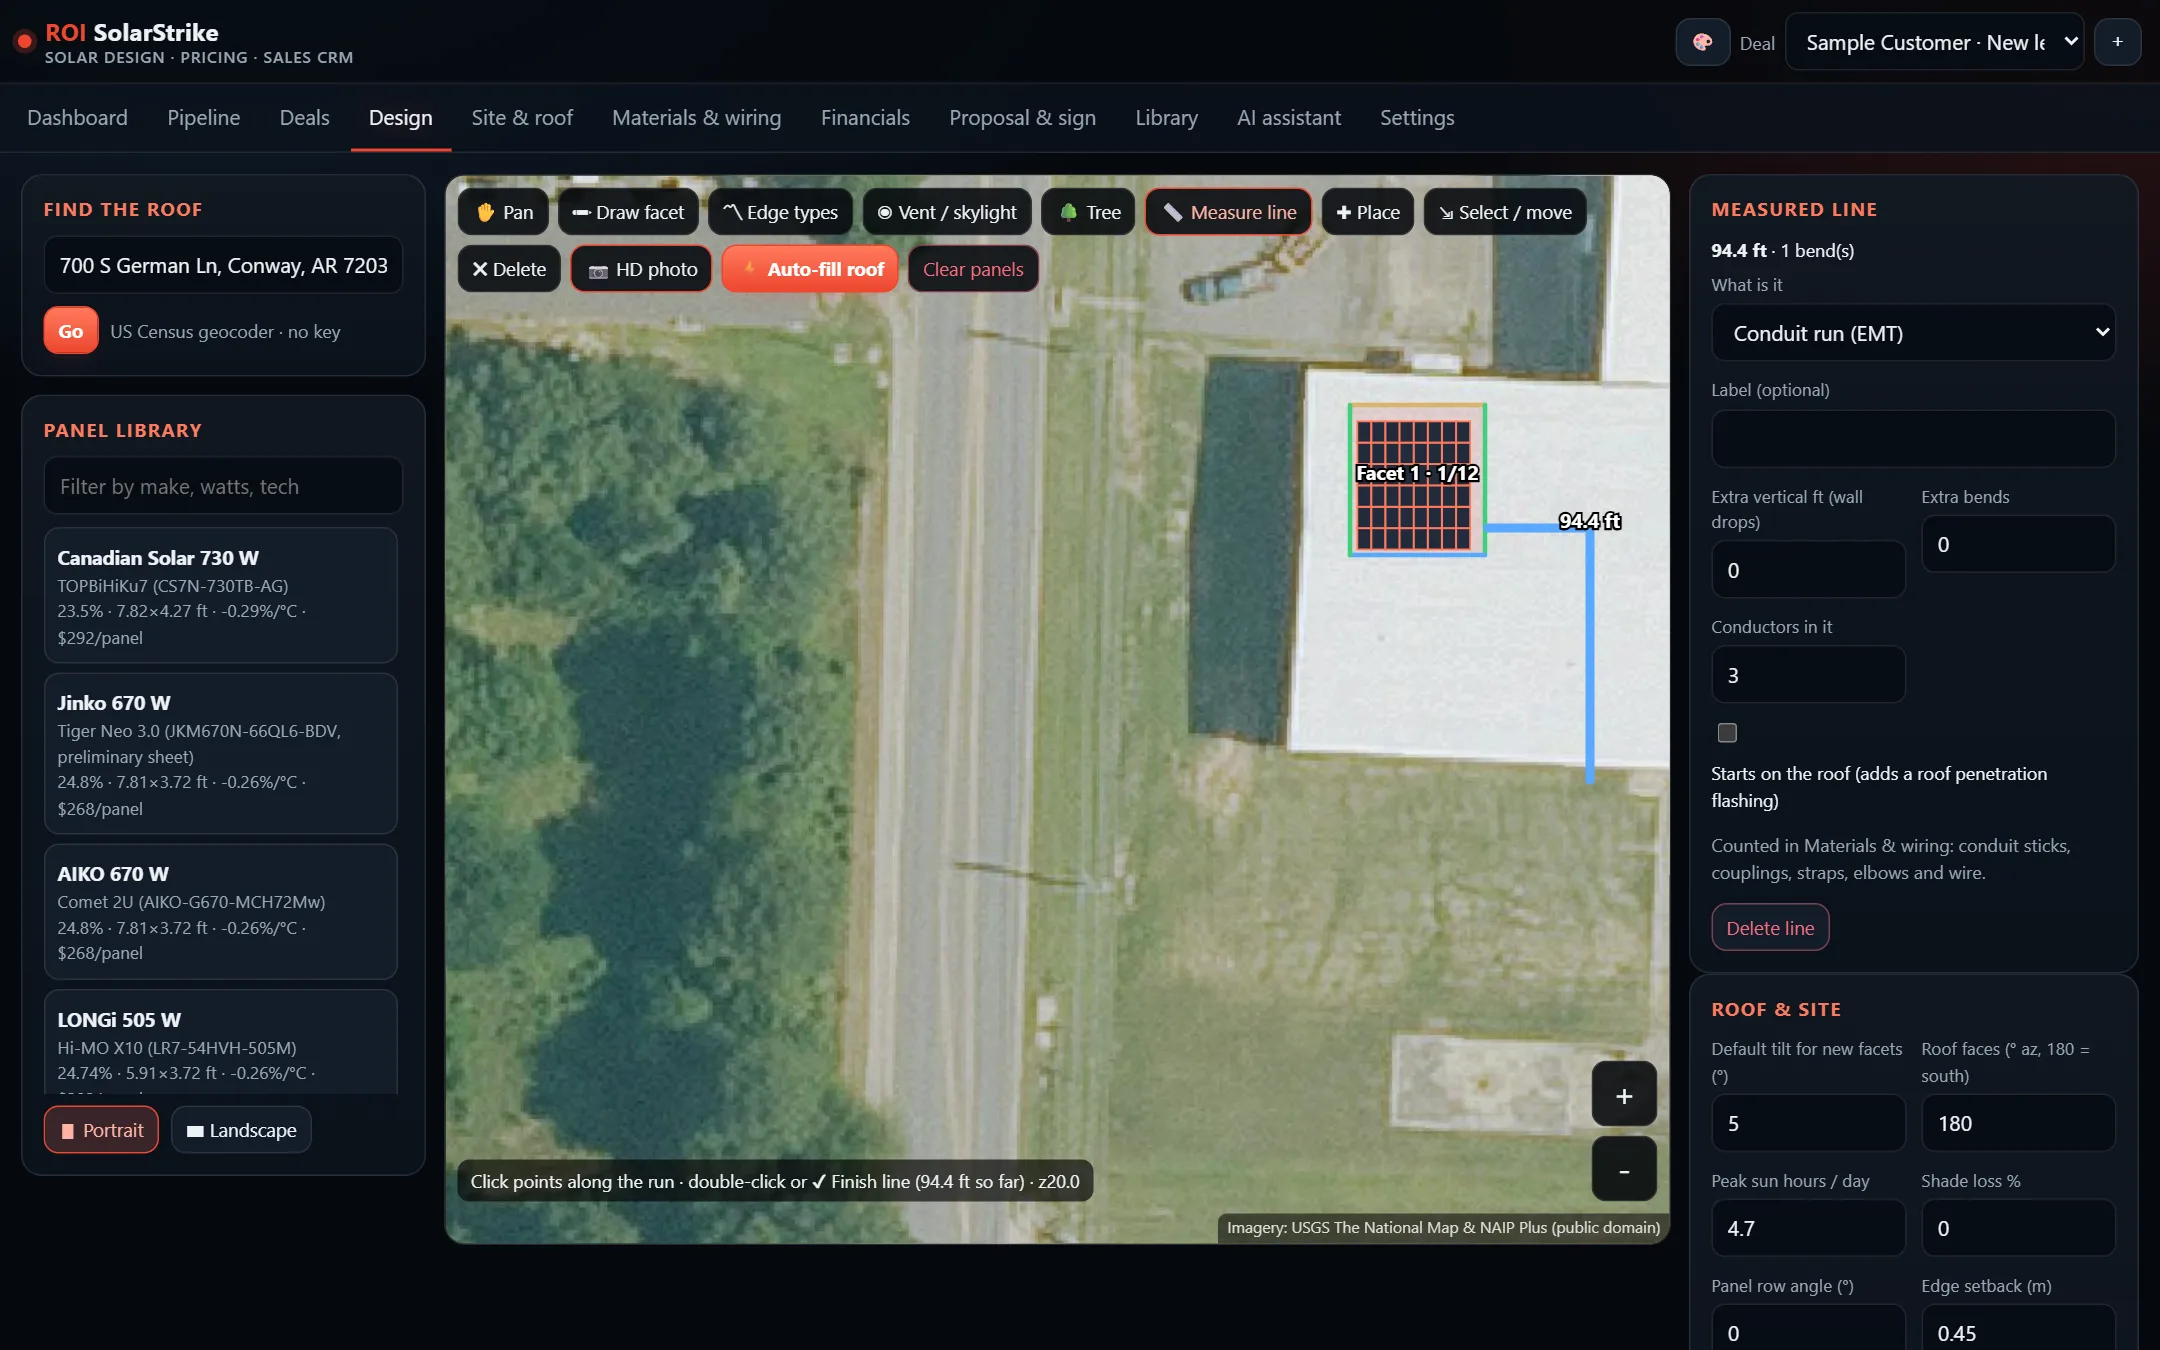
In ROI SolarStrike you pick the real panel model and it lands on the aerial photo at its datasheet size, adjusted for pitch, so you see exactly what fits on each roof face. Each panel's yearly kilowatt-hours are worked out from its own watts, heat rating and first-year fade, times sun hours and that face's tilt and direction, with year-round shade worked out panel by panel from the sun's path.
Draw the conduit run on the map and every strap, coupling and foot of wire is priced along with your racking, inverters, breakers and labor. The homeowner sees what's used on site and what's fed to the grid, each at its own rate, and a 25-year cash flow with loan payments, IRR, NPV and payback, shown as estimates. Your company's name goes on the proposal, and deals, tasks and follow-ups stay in one place.
It runs from one file in Chrome, Edge or Firefox on Windows, Linux or Android, and stores everything on your device.
Questions people ask
- How many kWh does one solar panel make a year?
- Roughly its watts ÷ 1,000 × peak sun hours per day × 365, then reduced for heat, fade, tilt, direction and shade. A 400-watt panel at 4.5 sun hours starts at about 657 kWh a year before those losses.
- What does the temperature coefficient mean?
- It's how much output a panel loses for each degree its cells run above the 25 °C test temperature, listed on the datasheet as a percent per °C. Hot roofs make less than the label watts.
- Why split on-site use from grid export?
- Power used in the house is worth the retail rate you'd otherwise buy at. Power sent to the grid is often credited at a different export rate. Using one rate for both overstates or understates the savings.
Keep reading